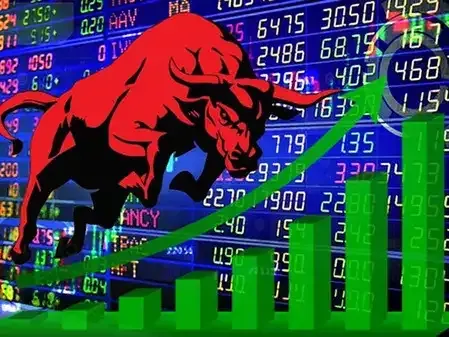
The Indian stock markets remained closed on Thursday due to the Bakri-Id holiday, but the volatility gauge India VIX showed a significant decrease, ending at 14.98, down by 7.12% from the last closing. Analysts are observing a sideways to mildly positive trend for the upcoming sessions, with the Nifty 50 index showing signs of consolidation.
Technical Analyst Vatsal Bhuva from LKP Securities noted that the Nifty 50 recently broke out above the 23,800 congestion zone, indicating improved momentum. Despite profit booking in the last two trading sessions, the index took support near its 20-day SMA, reflecting buying interest at lower levels. Significant call writing at the 24,000 strike suggests strong resistance, while aggressive put writing at 23,900 indicates immediate support.
In the U.S., stocks turned higher after reports of a ceasefire agreement between the United States and Iran, although the deal still requires approval from President Donald Trump. Meanwhile, European shares pared losses on similar news. Economic data from the U.S. showed a slower GDP growth rate, a drop in the saving rate, rising inflation, and a decline in new orders for core-capital goods.
“The Nifty 50 recently witnessed a breakout above the 23,800 congestion zone on the daily chart, indicating improving momentum in the index.”
Vatsal Bhuva, Technical Analyst at LKP Securities
According to Bajaj Broking, the Nifty formed a small bullish candlestick on the daily chart, indicating consolidation amid stock-specific activity. The index is testing the upper end of the breakout zone and could move towards the 24,200–24,300 zone if it sustains above the 23,835–23,922 gap area. Immediate support is placed around 23,600, with major support at the 23,200–23,000 region.
Among the most active stocks in value terms on the BSE were Pine Labs, L&T, and TVS Motor Company, while JP Power and Pine Labs led in volume terms. The sentiment meter favored bulls, with 2,220 stocks advancing out of 4,394 traded on the BSE.
Background
The market's current sideways trend reflects a period of consolidation following recent gains. Investors are closely monitoring geopolitical developments, such as the US-Iran ceasefire, which can significantly influence market sentiment.
Investors should watch for movements in resistance and support levels, as well as any geopolitical developments that could impact market sentiment.